Why Real Estate Investors
Should Disregard Most Housing Stats
Here is A U.S. Market Overview of Housing Dated September 2024:
- Average U.S. home prices: Home prices dropped slightly in Q2 2024 to an average of $501,700, down from $519,700 at the end of Q1. -- Irrelevant to investors
- 30-year interest rates: As of September 16th, 30-year mortgage rates averaged 6.12%, down from 7.29% on the same day last year. -- Likely very relevant to investors
- Median days on market: The median days on the market was 37 days, up six days year over year. Days on market is a good indicator of buyer demand. -- Irrelevant to investors
- Homes sold above list price: In August 2024, 30.1% of homes in the U.S. sold above list price, down 6.1 percentage points year over year. -- Irrelevant to investors
- Average starter home mortgage payment: Monthly housing payments for starter homes sold in July were $1,981, up 4.4% from a year ago. By definition, a starter home is a smaller, more affordable house, typically falling between the 5th and 35th percentiles in sale prices. -- Irrelevant to investors
Emotional Factors Drive Personal Residence Prices
- Subjective Valuation Over Economic Calculations:
- Comparable Sales as a Baseline: Real estate agents and appraisers rely on “comps” (recent sales of similar homes in the same area) to set listing prices or offers. For example, in Florida, a 3-bedroom, 2-bath home in a suburban neighborhood might sell for $350,000 based on comps, but this is just a starting point.
- “Feel Good” Elements: Buyers often pay premiums for features that evoke emotional responses, like a renovated kitchen, a backyard with a pool, or proximity to good schools. Sellers may inflate prices based on their attachment to the home or perceived unique qualities (e.g., “we raised our kids here”). Studies from the National Association of Realtors (NAR) show 60% of buyers are willing to pay 5-10% above comps for homes with desirable aesthetics or lifestyle benefits.
- Emotional Bidding: In competitive markets, bidding wars driven by fear of missing out (FOMO) can push prices 10-20% above asking. For instance, in 2024, Florida’s median home price rose to $435,000, partly due to emotional bidding in hot markets like Tampa and Orlando.
- Limited Economic Calculations:
- Unlike landlords, who analyze cash flow, cap rates, or ROI, most homebuyers don’t run detailed financial models. A 2023 Zillow survey found 70% of first-time buyers focus on monthly mortgage affordability rather than long-term investment potential.
- Buyers often overlook maintenance costs, property taxes, or resale potential, prioritizing immediate needs (e.g., space for a growing family). Sellers may set prices based on what they “need” to move (e.g., to cover a new home purchase) rather than market fundamentals.
- This leads to price volatility: NAR data shows personal residence sales in Florida fluctuate by ±8% year-over-year, compared to ±3% for investment properties, which are more tied to rental income and economic metrics.
- Impact on Housing Statistics:
- Median Sale Prices: Reported figures (e.g., $435,000 median in Florida, 2024) reflect emotional premiums, not just square footage or location. This skews perceptions of affordability for landlords, who may assume rental properties follow similar pricing logic.
- Days on Market (DOM): Emotion-driven sales can lead to faster or slower sales cycles. In 2025, Florida homes average 45 DOM, but “charm” factors like staging can cut this to 30 days, per Redfin.
- Price-to-Income Ratios: Emotional buying pushes home prices to 5.5x median household income in Florida (vs. a sustainable 3x), inflating statistics and signaling overvaluation risks.
Contrast with Landlord Decision-Making
For landlords, buying or selling rental properties is a business decision, not a personal one:
- Economic Metrics: Landlords calculate net operating income (NOI), capitalization rates (cap rates) (e.g., 5-7% in Florida), and cash-on-cash return to justify purchase prices. For example, a $400,000 duplex generating $3,000/month in rent might be valued strictly on its 6% cap rate, not its curb appeal.
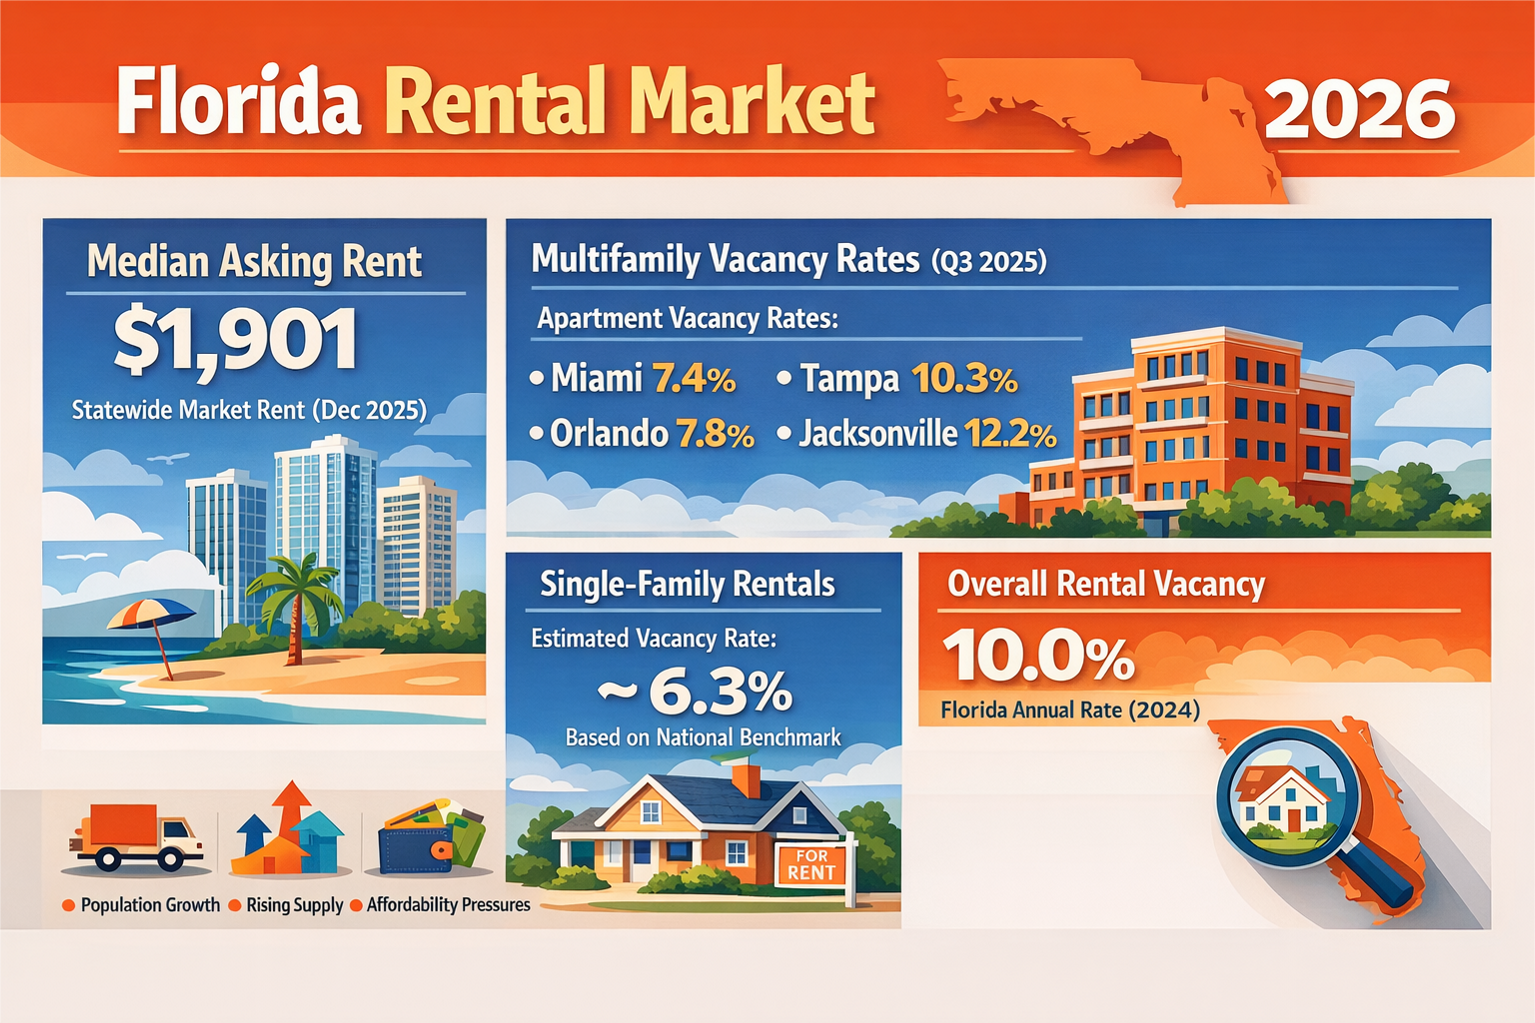
- Market Data-Driven: Landlords rely on rental yield trends (e.g., Florida’s 4.5% average yield in 2025) and vacancy rates (6.5%) to set prices, using tools like CoStar or Rentometer, not comps alone.
- Emotional Detachment: Unlike homeowners, landlords sell based on portfolio strategy (e.g., 1031 exchanges to defer taxes) or buy to meet tenant demand, not personal preferences.
This disconnect means housing statistics, which blend personal and investment sales, can mislead landlords. For instance, a reported 7% price increase in a county might reflect emotional homebuyer premiums, not rental property appreciation, affecting landlords’ acquisition strategies.
Here is One Method of Determining the Maximum Purchase Price of a Rental Based on ROI
Asking Price: ..................................................................$400,000
- Number of rental units: .............................................................2
- Monthly Gross Rent per unit: ...................................................$1,500
Estimated Income
- Annualized Gross Rent: ........................................................$36,000
- Estimated vacancy loss: .............................................................5%
- Annualized vacancy loss: .......................................................$1,800
- Adjusted Gross Income: ........................................................$34,200
Estimated Expenses
- Management Fee (% of Adjusted Gross Income)........................................10%
- Dollars: .................................................................$3,420
- Maintenance Rate (% of Adjusted Gross Income)......................................5%
- Dollars: .................................................................$1,800
- Property Tax (% of Asking price)..................................................1.8%
- Dollars...................................................................$7,200
- Insurance......................................................................$3,000
- HOA Dues (See "Never buy a rental property if there is an HOA")..................$500
- Total Expenses................................................................$15,920
- Net Income (Adjusted Gross Rent minus Total Expenses).........................$18,280
- Return on Investment (Net Income divided by Purchase Price).......................4.6%
So, in this example, if the buyer wants a minimum of 6% ROI the offering price must be reduced accordingly.
This is why real estate investors are rarely affected by market gyrations. It does not matter what was the selling price of the property next door. The question is how much Net Income can the property will produce?